THIS WEBSITE HAS BEEN RETIRED.
Information on the interactive Roaring Fork Observation network can be found at:
agci.org/iRON

Welcome to iRON, a public website devoted to data on climate and environmental conditions in the Roaring Fork Valley. From soil moisture to forest cover, measurements in our valley offer important insight into the conditions and trends over time within our local ecosystems. iRON gathers information about multiple indicators within our valley and offers it on a single site, placing it within the context of climate change. This website is still under development.
Tuesday, November 1, 2016
Thursday, July 7, 2016
If a Tree Falls in the Forest...

By Adam Korenblat
(A special post from our summer intern)
North Star Preserve is a 175-acre tract of open space located east of Aspen along the Roaring Fork River. This area supports high levels of biodiversity among bird species and hosts a diversity of habitats, including aspen groves, riparian areas, wetlands, and meadows. Due to this site's ecological significance, Pitkin County is interested in tracking soil moisture conditions and has partnered with AGCI to monitor North Star preserve starting in 2015. This May several individual sensors at one of the North Star sites stopped recording information on the associated web link AGCI uses to receive data.
Just a few days after the sensors went silent, we set out to find what had tampered with one of the North Star sites, specifically, the North Star Aspen Grove site. There are currently two sites located on the North Star Preserve, one located within the aspen grove and one located near the aspen grove, in a transition zone between a fen and a meadow. Because the sites are located far from any buildings, checking the sites during any mishap requires an in-person visit. Elise, AGCI’s research associate, and I prepared ourselves for various outcomes. In the area where the station is located, multiple sources of disturbances to the station are always possible. Signs of bears, moose, and elk are all common in the area. Alternatively, there are many small mammals that could have chewed through the wires and caused the iRON equipment to stop collecting data. We armed ourselves with bear spray and reflective tape to fend small mammals off any exposed wires and brought along a toolbox with the full suite of equipment necessary to fix a toppled tower. We ventured into the aspen grove to assess the damage done to the site.
We arrived at the site to find no evidence of bear, moose, elk, or small mammal damage but instead a large, dead and highly weathered aspen tree. The tree had fallen merely 2 feet from the iRON tower and managed to land directly on one of the three guy wire stakes attached to the station. The force of the resulting jerk to the tower cleanly broke the temperature/relative humidity sensor's cable and managed to unplug the temperature sensor and 8 and 20 inch soil moisture probes. What we believed to be a severely damaged site turned out to be a relatively easy fix. We replaced the broken temperature/relative humidity probe and re-plugged the temperature, 8 inch soil moisture, and 20 inch soil moisture probes. The hardest part of the fix was removing the guy wire and stake from under the dead aspen tree.

The fallen tree near the Aspen Grove site left us feeling very lucky, considering that the tree could have easily taken out the entire station. We prepared for a disaster and came upon a minimally damaged station. This day gave us a reminder that coming prepared allows for a smooth running day. Even though bringing a full toolbox may seem like a burden, we were able to make the necessary repairs and, despite the negatives involved with a damaged site, we came out with positive attitudes.
About the Author:
Adam Korenblat is currently a student at the University of Colorado at Boulder. He joined AGCI as an intern this summer and moved out of his apartment in Boulder to head up to the Roaring Fork Valley. After a first day that consisted of collecting soil at Spring Valley, the iRON’s newest site, he immediately came to the understanding that this internship fits him quite well. Overall he is enjoying this internship very much and looks forward to many more days in the field!
Tuesday, March 8, 2016
Rain, Snow, and the Soil Moisture Situation

While Aspen and the high country enjoyed a dusting of snow over the weekend, lower elevations in Basalt, Carbondale, and Glenwood Springs instead just felt a deluge of cold rain. In an arid state like Colorado, any type of precipitation usually seems like a good thing, but whether that precipitation comes in the form of rain or snow can make a difference to ecosystem conditions that lasts throughout the growing season.
Each spring since the iRON stations have been installed, they show sudden peak in soil moisture as snow cover melts and as the ground thaws out. Depending on the elevation of the individual station and the snowpack and temperatures we have had over the winter, these spikes in soil moisture usually occur somewhere between mid-March and mid-April. Once this "spring soak" has occurred, soil moisture at the iRON sites tend to follow a general trend decline, with only small spikes in moisture increase, until mid to late summer, when heavy intensity rain storms of over 0.8inches of rain in a single day help to recharge soil moisture all the way down to a 20 inch depth. The graph below shows an example of the patterns of soil moisture shown at the Sky Mountain station from its installation through the present.

Other, lower elevation stations, such as the one at Glenwood Springs may show an earlier date of soil saturation. This is the first winter/spring transition for which there has been a station at Glenwood Springs, so we are unable to compare it to other years, but an increase in soil moisture at all three depths (2,8, and 20in) had already began around February 14th this year, which a sharper spike in soil moisture increase on February 18th. As our data record grows will be able to compare dates of soil thaw, periods of warm winter temperatures, and rain events to soil moisture in order to better understand the interplay between these factors.
Wednesday, November 18, 2015
In It for the Long Haul
 |
| Niwot Ridge LTER Site. Image Credit: Jeff Taylor |
Perhaps one of the most famous legacies of long term monitoring is that of Charles David Keeling, whose perseverance in recording and maintaining careful records of Carbon dioxide concentrations at Mauna Loa, Hawaii played a critical role in identifying human influence on atmospheric greenhouse gas concentrations and the climate.
 |
| Tundra at Niwot Ridge LTER. Image Credit: Jeff Taylor |
These diverse stations are unified by three key characteristics: research must occur within areas that have been specifically identified as representative ecosystem types, it must focus on phenomena that occur on long time scales, and it must have cross-site applications. Collecting consistent data over extended durations of time is critical to understanding the natural world because ecosystem processes occur on different temporal scales. Some insects may live as adults for only a few days before mating and dying and be influenced by habitat conditions over a very short period of time. Forests, by contrast, are characterized by species that may live hundreds of years and cycles of disturbance and regeneration that take even longer to fully manifest their impacts. Long term research networks, therefore, are crucial to identifying trends that occur on scales that may be longer than a typical researchers' career or that may have repercussions within our lifetimes.
At Niwot Ridge LTER in Colorado, for example, the data collected are being applied to furthering understanding in a variety of fields that directly impacts people's daily lives, such as: water dynamics or identifying warning signs of harmful levels of air pollution.
Because ecological monitoring reveals trends over time, it can sometimes be challenging at the outset to estimate in exactly what ways the data will be most valuable. As we establish our own, local monitoring network in the iRON, we will consider local interests and information needs, as well as build upon research from other areas to identify potentially valuable areas of investigation. The iRON may be in its early days still, but every monitoring network has to start sometime, and with the context of a rapidly changing climate as a background, starting now offers an abundant opportunity to start understanding what those changes mean for our own valley.
Friday, August 28, 2015
Neighbors in the Field

One of my favorite aspects of fieldwork happens to be the same component that makes ecological research so challenging: you are not working in a controlled environment. This means that you never know what--or whom you may run across on any given day.

Once the calibration is complete, the soil is returned to its original hole. It is especially important to return the samples to the hole in the correct order if soil type varied by depth. At one location where we collected soil yesterday, soil became progressively more sandy as we dug down, and the difference between the dark, soft soil near the surface and the light, sandy soil at 20 inches (50 cm) was quite striking!
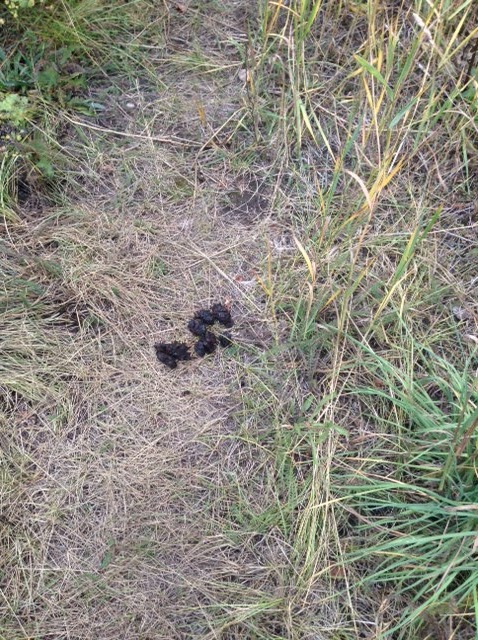
 During our soil collection we did not see much wildlife, but evidence of one particular neighbor in the field was quite evident, as we walked to and from our sites. Black bears (Usus americanus) are quite common in the Roaring Fork Valley, and we were not surprised that many of the aspens in the study area were marked with numerous gouges from bears, some of whom had clearly been climbing the trees. What did give us pause, however, was how very new many of the markings were--so new in places, that the raised wood was still light in color and splintery. Additionally, we found multiple piles of fresh bear scat in a range of sizes. (It seems that service berries are good eating up there.) These clues that we may be working in an area favored by the large, furry locals offered an important reminder to remain alert at this, and other, sites.
We'll be back to these new site locations in a few weeks to install the climate and soil moisture stations, and we'll be sure to share any special signs or sightings of our neighbors.
Wednesday, July 8, 2015
On the Learning Trail
 |
| The Viewline Trail. Credit: AGCI |
This time of year is a beautiful season for field work. We have been visiting our monitoring stations for their spring check-ups and updates, and we've been generating all kinds of questions about the natural world along the way!
Visting the Brush Creek station at the end of June, one of the first things I noticed was a small gang of ground squirrels basking in the dust of the pull-off from the road. I had suspected all winter that voles were the ones eating our wires, but it looks like there may have been competition in the rodent destruction department. So far, the new piping we buried in the spring has kept rodent visitors of all species out, though, and we're keeping our fingers crossed that this prevention method will continue to be successful.
 |
| Evening Primrose. Credit: AGCI |
Summer colors were in no shortage that day. The wildflowers were in vibrant bloom, and along the purple lupine edged trail, we stopped to take photos of some other wildflowers that neither of us recognized by name. One of our favorite discoveries was a white flower we later found to be evening primrose (Oenothera casepitosa). The distinctive nature of this white flower made it easy to identify in a search: its large petals were notably heart-shaped. Even more remarkable, however, was the manner in which the flower altered over the course of the day. In the morning, when we hiked up the trail, the flowers looked fresh and in full bloom, but by mid-day, when we hiked down, the flowers looked wilted and crumpled.
 |
| Tent caterpillar. Credit: AGCI |
These types of learning experiences are one of the best parts of field work, in my opinion. They also help to inform the research we are conducting in an indirect way. The primary purpose of our monitoring sites is to shed light on the dynamics of soil moisture in a changing climate. In ecology, however, each component of the system interacts with the other components around it. The soil moisture helps determine which plants can grow in an area, and these plants in turn dictate the likely fauna of the region. The biotic and the abiotic factors of any ecosystem are intricately intertwined. As a consequence, keeping a weather eye open for changes in timing and presence of a natural event or species can prove helpful in creating a broad understanding of the ecosystem being studied. There is an even subtler benefit to this type of inquiry as well though. Curiosity is the driving force behind science, and by taking the time to ask questions and peer at flowers, two researchers at least are feeding the wonder that keeps them working in this field.
Thursday, May 7, 2015
Muddy Waters Don't Always Mean the Blues
 |
| Meeting of Frying Pan and Roaring Fork Rivers after a heavy rain. Image Credit: John K., 2015 |
Rivers running red may sound ominous, but in the Roaring Fork Watershed it is a common spring phenomena. Heavy (or persistent) rains wash the red, iron-rich soil from steep areas of the slopes surrounding the Frying Pan into the swift-flowing waters of the river. This sediment laden water is carried downstream to Basalt where it joins the also high-flowing Roaring Fork River, creating a striking visual at the confluence.
That there has been a lot of erosion in the last few days is no surprise. Over the last week, all of our soil moisture stations showed over .95 inches of rain, with the Brush Creek station (near Snowmass Village) and Glassier Ranch station (near Basalt) showing as much as 1.39 inches in a single week. Between .8 and .9 inches of that rain fell in just 24 hours. To put that in scale, the Roaring Fork Valley receives only 16-19 inches of precipitation on average per year. Last year, the most rain falling in a single 24 hour period was around .8 inches. Last year, such deluges did not occur until late summer.
In the arid state of Colorado, a good soaking is generally considered a good thing. What this heavy rain in early May means for water availability during the rest of the growing season is, like the Frying Pan, unclear. The rate at which soil dries depends on a number of related factors including air temperature, humidity, and plant water use. Consequently, weather conditions over the coming months will play a big role in how long this moisture sticks around in the soil.
So far, this week's rain has raised soil moisture by the notable amount of between 7 and 10% at our sites at a 2 inch depth. Soil moisture at the 8 and 20 inch depths has only risen by between 1 and 2% so far, but as water from the shallow depths has time to percolate, these numbers may rise further.
As we continue to move toward summer, collection of data from the research sites will help to illuminate the relationship between precipitation, temperature, and soil moisture. In the meantime, the vegetation shows its response to the rain by making the valley look especially verdant and bright.
 |
| Data from the Smuggler Mountain Site from 4/30/15-05/07/15. It is important to note that the scales of water moisture are not consistent across the three graphs. As a result, although all lines visually appear to rise by similar amounts, the 2in depth is actually showing a much greater increase numerically. Image Credit: AGCI, using Hobolink data collection and graphs. |
Subscribe to:
Posts (Atom)