THIS WEBSITE HAS BEEN RETIRED.
Information on the interactive Roaring Fork Observation network can be found at:
agci.org/iRON

Welcome to iRON, a public website devoted to data on climate and environmental conditions in the Roaring Fork Valley. From soil moisture to forest cover, measurements in our valley offer important insight into the conditions and trends over time within our local ecosystems. iRON gathers information about multiple indicators within our valley and offers it on a single site, placing it within the context of climate change. This website is still under development.
Tuesday, November 1, 2016
Thursday, July 7, 2016
If a Tree Falls in the Forest...

By Adam Korenblat
(A special post from our summer intern)
North Star Preserve is a 175-acre tract of open space located east of Aspen along the Roaring Fork River. This area supports high levels of biodiversity among bird species and hosts a diversity of habitats, including aspen groves, riparian areas, wetlands, and meadows. Due to this site's ecological significance, Pitkin County is interested in tracking soil moisture conditions and has partnered with AGCI to monitor North Star preserve starting in 2015. This May several individual sensors at one of the North Star sites stopped recording information on the associated web link AGCI uses to receive data.
Just a few days after the sensors went silent, we set out to find what had tampered with one of the North Star sites, specifically, the North Star Aspen Grove site. There are currently two sites located on the North Star Preserve, one located within the aspen grove and one located near the aspen grove, in a transition zone between a fen and a meadow. Because the sites are located far from any buildings, checking the sites during any mishap requires an in-person visit. Elise, AGCI’s research associate, and I prepared ourselves for various outcomes. In the area where the station is located, multiple sources of disturbances to the station are always possible. Signs of bears, moose, and elk are all common in the area. Alternatively, there are many small mammals that could have chewed through the wires and caused the iRON equipment to stop collecting data. We armed ourselves with bear spray and reflective tape to fend small mammals off any exposed wires and brought along a toolbox with the full suite of equipment necessary to fix a toppled tower. We ventured into the aspen grove to assess the damage done to the site.
We arrived at the site to find no evidence of bear, moose, elk, or small mammal damage but instead a large, dead and highly weathered aspen tree. The tree had fallen merely 2 feet from the iRON tower and managed to land directly on one of the three guy wire stakes attached to the station. The force of the resulting jerk to the tower cleanly broke the temperature/relative humidity sensor's cable and managed to unplug the temperature sensor and 8 and 20 inch soil moisture probes. What we believed to be a severely damaged site turned out to be a relatively easy fix. We replaced the broken temperature/relative humidity probe and re-plugged the temperature, 8 inch soil moisture, and 20 inch soil moisture probes. The hardest part of the fix was removing the guy wire and stake from under the dead aspen tree.

The fallen tree near the Aspen Grove site left us feeling very lucky, considering that the tree could have easily taken out the entire station. We prepared for a disaster and came upon a minimally damaged station. This day gave us a reminder that coming prepared allows for a smooth running day. Even though bringing a full toolbox may seem like a burden, we were able to make the necessary repairs and, despite the negatives involved with a damaged site, we came out with positive attitudes.
About the Author:
Adam Korenblat is currently a student at the University of Colorado at Boulder. He joined AGCI as an intern this summer and moved out of his apartment in Boulder to head up to the Roaring Fork Valley. After a first day that consisted of collecting soil at Spring Valley, the iRON’s newest site, he immediately came to the understanding that this internship fits him quite well. Overall he is enjoying this internship very much and looks forward to many more days in the field!

Tuesday, March 8, 2016
Rain, Snow, and the Soil Moisture Situation

While Aspen and the high country enjoyed a dusting of snow over the weekend, lower elevations in Basalt, Carbondale, and Glenwood Springs instead just felt a deluge of cold rain. In an arid state like Colorado, any type of precipitation usually seems like a good thing, but whether that precipitation comes in the form of rain or snow can make a difference to ecosystem conditions that lasts throughout the growing season.
Each spring since the iRON stations have been installed, they show sudden peak in soil moisture as snow cover melts and as the ground thaws out. Depending on the elevation of the individual station and the snowpack and temperatures we have had over the winter, these spikes in soil moisture usually occur somewhere between mid-March and mid-April. Once this "spring soak" has occurred, soil moisture at the iRON sites tend to follow a general trend decline, with only small spikes in moisture increase, until mid to late summer, when heavy intensity rain storms of over 0.8inches of rain in a single day help to recharge soil moisture all the way down to a 20 inch depth. The graph below shows an example of the patterns of soil moisture shown at the Sky Mountain station from its installation through the present.

Other, lower elevation stations, such as the one at Glenwood Springs may show an earlier date of soil saturation. This is the first winter/spring transition for which there has been a station at Glenwood Springs, so we are unable to compare it to other years, but an increase in soil moisture at all three depths (2,8, and 20in) had already began around February 14th this year, which a sharper spike in soil moisture increase on February 18th. As our data record grows will be able to compare dates of soil thaw, periods of warm winter temperatures, and rain events to soil moisture in order to better understand the interplay between these factors.
Wednesday, November 18, 2015
In It for the Long Haul
 |
| Niwot Ridge LTER Site. Image Credit: Jeff Taylor |
Perhaps one of the most famous legacies of long term monitoring is that of Charles David Keeling, whose perseverance in recording and maintaining careful records of Carbon dioxide concentrations at Mauna Loa, Hawaii played a critical role in identifying human influence on atmospheric greenhouse gas concentrations and the climate.
 |
| Tundra at Niwot Ridge LTER. Image Credit: Jeff Taylor |
These diverse stations are unified by three key characteristics: research must occur within areas that have been specifically identified as representative ecosystem types, it must focus on phenomena that occur on long time scales, and it must have cross-site applications. Collecting consistent data over extended durations of time is critical to understanding the natural world because ecosystem processes occur on different temporal scales. Some insects may live as adults for only a few days before mating and dying and be influenced by habitat conditions over a very short period of time. Forests, by contrast, are characterized by species that may live hundreds of years and cycles of disturbance and regeneration that take even longer to fully manifest their impacts. Long term research networks, therefore, are crucial to identifying trends that occur on scales that may be longer than a typical researchers' career or that may have repercussions within our lifetimes.
At Niwot Ridge LTER in Colorado, for example, the data collected are being applied to furthering understanding in a variety of fields that directly impacts people's daily lives, such as: water dynamics or identifying warning signs of harmful levels of air pollution.
Because ecological monitoring reveals trends over time, it can sometimes be challenging at the outset to estimate in exactly what ways the data will be most valuable. As we establish our own, local monitoring network in the iRON, we will consider local interests and information needs, as well as build upon research from other areas to identify potentially valuable areas of investigation. The iRON may be in its early days still, but every monitoring network has to start sometime, and with the context of a rapidly changing climate as a background, starting now offers an abundant opportunity to start understanding what those changes mean for our own valley.
Friday, August 28, 2015
Neighbors in the Field

One of my favorite aspects of fieldwork happens to be the same component that makes ecological research so challenging: you are not working in a controlled environment. This means that you never know what--or whom you may run across on any given day.

Once the calibration is complete, the soil is returned to its original hole. It is especially important to return the samples to the hole in the correct order if soil type varied by depth. At one location where we collected soil yesterday, soil became progressively more sandy as we dug down, and the difference between the dark, soft soil near the surface and the light, sandy soil at 20 inches (50 cm) was quite striking!
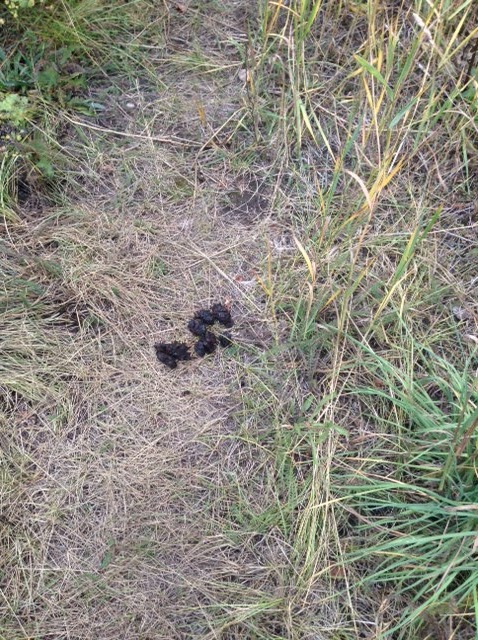
 During our soil collection we did not see much wildlife, but evidence of one particular neighbor in the field was quite evident, as we walked to and from our sites. Black bears (Usus americanus) are quite common in the Roaring Fork Valley, and we were not surprised that many of the aspens in the study area were marked with numerous gouges from bears, some of whom had clearly been climbing the trees. What did give us pause, however, was how very new many of the markings were--so new in places, that the raised wood was still light in color and splintery. Additionally, we found multiple piles of fresh bear scat in a range of sizes. (It seems that service berries are good eating up there.) These clues that we may be working in an area favored by the large, furry locals offered an important reminder to remain alert at this, and other, sites.
We'll be back to these new site locations in a few weeks to install the climate and soil moisture stations, and we'll be sure to share any special signs or sightings of our neighbors.
Wednesday, July 8, 2015
On the Learning Trail
 |
| The Viewline Trail. Credit: AGCI |
This time of year is a beautiful season for field work. We have been visiting our monitoring stations for their spring check-ups and updates, and we've been generating all kinds of questions about the natural world along the way!
Visting the Brush Creek station at the end of June, one of the first things I noticed was a small gang of ground squirrels basking in the dust of the pull-off from the road. I had suspected all winter that voles were the ones eating our wires, but it looks like there may have been competition in the rodent destruction department. So far, the new piping we buried in the spring has kept rodent visitors of all species out, though, and we're keeping our fingers crossed that this prevention method will continue to be successful.
 |
| Evening Primrose. Credit: AGCI |
Summer colors were in no shortage that day. The wildflowers were in vibrant bloom, and along the purple lupine edged trail, we stopped to take photos of some other wildflowers that neither of us recognized by name. One of our favorite discoveries was a white flower we later found to be evening primrose (Oenothera casepitosa). The distinctive nature of this white flower made it easy to identify in a search: its large petals were notably heart-shaped. Even more remarkable, however, was the manner in which the flower altered over the course of the day. In the morning, when we hiked up the trail, the flowers looked fresh and in full bloom, but by mid-day, when we hiked down, the flowers looked wilted and crumpled.
 |
| Tent caterpillar. Credit: AGCI |
These types of learning experiences are one of the best parts of field work, in my opinion. They also help to inform the research we are conducting in an indirect way. The primary purpose of our monitoring sites is to shed light on the dynamics of soil moisture in a changing climate. In ecology, however, each component of the system interacts with the other components around it. The soil moisture helps determine which plants can grow in an area, and these plants in turn dictate the likely fauna of the region. The biotic and the abiotic factors of any ecosystem are intricately intertwined. As a consequence, keeping a weather eye open for changes in timing and presence of a natural event or species can prove helpful in creating a broad understanding of the ecosystem being studied. There is an even subtler benefit to this type of inquiry as well though. Curiosity is the driving force behind science, and by taking the time to ask questions and peer at flowers, two researchers at least are feeding the wonder that keeps them working in this field.
Thursday, May 7, 2015
Muddy Waters Don't Always Mean the Blues
 |
| Meeting of Frying Pan and Roaring Fork Rivers after a heavy rain. Image Credit: John K., 2015 |
Rivers running red may sound ominous, but in the Roaring Fork Watershed it is a common spring phenomena. Heavy (or persistent) rains wash the red, iron-rich soil from steep areas of the slopes surrounding the Frying Pan into the swift-flowing waters of the river. This sediment laden water is carried downstream to Basalt where it joins the also high-flowing Roaring Fork River, creating a striking visual at the confluence.
That there has been a lot of erosion in the last few days is no surprise. Over the last week, all of our soil moisture stations showed over .95 inches of rain, with the Brush Creek station (near Snowmass Village) and Glassier Ranch station (near Basalt) showing as much as 1.39 inches in a single week. Between .8 and .9 inches of that rain fell in just 24 hours. To put that in scale, the Roaring Fork Valley receives only 16-19 inches of precipitation on average per year. Last year, the most rain falling in a single 24 hour period was around .8 inches. Last year, such deluges did not occur until late summer.
In the arid state of Colorado, a good soaking is generally considered a good thing. What this heavy rain in early May means for water availability during the rest of the growing season is, like the Frying Pan, unclear. The rate at which soil dries depends on a number of related factors including air temperature, humidity, and plant water use. Consequently, weather conditions over the coming months will play a big role in how long this moisture sticks around in the soil.
So far, this week's rain has raised soil moisture by the notable amount of between 7 and 10% at our sites at a 2 inch depth. Soil moisture at the 8 and 20 inch depths has only risen by between 1 and 2% so far, but as water from the shallow depths has time to percolate, these numbers may rise further.
As we continue to move toward summer, collection of data from the research sites will help to illuminate the relationship between precipitation, temperature, and soil moisture. In the meantime, the vegetation shows its response to the rain by making the valley look especially verdant and bright.
 |
| Data from the Smuggler Mountain Site from 4/30/15-05/07/15. It is important to note that the scales of water moisture are not consistent across the three graphs. As a result, although all lines visually appear to rise by similar amounts, the 2in depth is actually showing a much greater increase numerically. Image Credit: AGCI, using Hobolink data collection and graphs. |
Thursday, April 2, 2015
The Trouble with Voles
 |
| Meadow Vole, side view. Image Credit: Japanese Tea, Wikimedia Commons |
Thus we come to the trouble with voles. They are not friends to long-term monitoring, at least not to the sensors that gather data. We suspected a threat might be crouching on the horizon last August when we noticed numerous holes dotting the ground during a siting visit for one our soil moisture and climate monitoring stations. During the installation of the site, suspicions were confirmed when I saw a small, brown shape shoot from one hole to another. It was a vole. I did not get a clear enough view to say which of the Roaring Fork's five species graced our site with its presence, but I did see enough to know that rodent presence in the area might be a challenge to our data collection.
Right from installation, any exposed wire at the site was wrapped in reflective tape, a common method for deterring rodents. After the one sensor became damaged at the start of winter, I secured the remaining sensors in an additional 5 five layers of the aluminum tape. The resulting bundle was as wide around as the pvc pipe used to protect the wires stretching from the tower to their monitoring location location. This measure was only sufficient until the end of winter. Last week, we made a repair visit to the site and found a pile of small rolls of aluminum tape that had been plucked from the wires and flung about a 2-foot diameter radius in little, chewed-upon balls. In addition to removing the protective tape from the exposed section of wire, the voles had pulled a greater length of wire out of the PVC pipe to access further surfaces for chewing. The wires themselves had been completely chewed through. It was both distressing and impressive.

Science loves nothing like a challenge, however, and we were game for this one. Having preemptively armed ourselves with piping elbows, lengths of unused pipe, duct tape, and reflective tape, we removed the damaged soil sensors and replaced them with new equipment--now protected by an elaborate system of piping that descends underground to a depth of over 6 inches.
By the end of the afternoon, storm clouds were beginning to scud in, bringing with them a biting wind. But before the rain and chill drove us out, we were able to burry new sensors (now successfully gathering data) and collect the damaged sensors for later repair. Previous splicing experience will soon be put to the test as we attempt to salvage our vole-ravaged wires.
 |
| Stringing the wires from the hole to the logger tower. Image Credit: AGCI, 2015 |
Sometimes research looks like a calm lab technician in a white coat surrounded by spotless beakers, sometimes it looks like someone intent on a computer screen running data through a newly designed modeling system, and sometimes it looks like a person lying on her stomach in the soil and spikey grass, taping wires with muddy fingers. All of these scenarios represent the earnest endeavor to better understand how this world works and the ways it may be changing over time. The one scenario we hope science does not look like any time soon is a charming little rodent with its mouth full of wire.
Huggins, Jain Lindsey. 2004. Wild at Heart. WHO Press. Basalt, CO.
Friday, January 9, 2015
2015 Year of the Soil!
 |
| Soil profile at Brush Creek. Image Credit: AGCI, 2014 |
It's official, this year is the year to dig your hands into the dirt!
The Food and Agriculture Organization (FAO) of the United Nations has officially declared 2015 the "International Year of Soils." The humble earth beneath our feet is receiving this recognition for a variety of reasons. Soil is the foundation of all plant life on Earth (literally!) from the foods we eat, to the flowers we admire, or the forests that become timber to build tools or homes.
Soil plays a critical role in non-living systems as well. It filters and stores ground water, it interacts with the atmosphere and it can play a role in the warming (or cooling) of microclimates.
While all soils serve a similar purpose within their ecosystems, soil is incredibly diverse. Soil comes in a variety of colors, textures, and chemical compositions. Different soils also have their own individual arrays of bacteria.
Here within the Roaring Fork Valley, some of this diversity is evident even from a distance. Traveling from Glenwood Springs to Aspen, the soil undergoes a visible change from the bright red, iron-rich soil near Glenwood to the more muted brown tones of the soil up near Aspen.
These soils differ on a less-visible level as well. Among the four study sites that currently comprise the Roaring Fork Soil Moisture Network, there are clear differences in soil texture and composition.
At Smuggler Mountain, the soil is a slightly acidic, loose loam (a mix of sand, silt, and clay) with less than 1% organic matter. It's low in nitrogen, but high in phosphorus.
At Sky Mountain, by contrast, the soil is also a loam, but it is less acidic and more densely packed. The organic matter is much higher--around 11%, and it has more nitrogen available than phosphorus.
The Brush Creek site, a meadow, is very different from the two forested sites. It's classified as clay and is nearer to neutral pH than the other two sites. Its organic matter content is around 7% and its nitrogen and phosphorus availability are close to one another.
Glassier, which is something of a wetland in the summer, is a sandy loam, and near the surface, it is near neutral for pH and has a high phosphorus availability and 33% organic matter.
The differences in the soils is both driven by and drives the type of plants that live in these areas. For example, at Smuggler Mountain, the low nitrogen availability may limit what types of plants are able to establish and succeed in the area. Meanwhile, the fact that the dominant vegetation in the area are conifers likely contributes to the acidic nature of the soil. (Needles from conifers tend to lead to acidic soils when the decompose.)
Soil is an important determinant in the type of ecological communities you find, no matter where you go on Earth--and the relationship is reciprocal. So what does the soil like where you live? 2015 is the year to find out!
 |
| Digging in at Brush Creek. Image Credit: AGCI, 2014 |
Tuesday, November 18, 2014
Goodbye Field Season, Hello Data Analysis
.jpg) |
| A newly installed station. Image credit: AGCI, 2014. |
It's been a busy summer here on the soil moisture front! Since March, two new soil monitoring sites were scouted and tested, and two new stations are now on the ground, courtesy of Pitkin County Parks and Open Space!
Both of the new stations differ slightly from the two previous stations. The existing stations, at Smuggler Mountain and Sky Mountain, are sited in relatively undisturbed natural areas. The two new stations, by contrast, are both sitting on heavily disturbed land--land that has been altered from its natural state by prolonged human activities. The Glassier site overlooks the Roaring Fork River from a riparian zone on a former ranch, and the much of the surrounding property will still be used for agricultural purposes in the future. The Brush Creek site is in a high mountain meadow formerly used for grazing. The Brush Creek meadow is currently dominated by an invasive species of brome grass that was commonly planted by early ranchers in the Roaring Fork Valley because it is good for grazing.
.jpg) |
| Observations of site hole. Image credit: AGCI, 2014. |
Another new addition this summer is the variable of soil temperature. Soil temperature probes have been included at both of the two new stations, added to the station at Smuggled Mountain, and will be soon added to Sky Mountain site as well.
Installing a soil monitoring and weather station is a multi-step process.
The first step is site selection. Ideally, the ground should be relatively level, soil moisture of the exact site should be comparable to other soil moisture readings taken nearby, and it needs to be high enough above any local rivers or creeks that high spring flows won't flood the area.
 |
| Conducting a perc test. Image credit: AGCI, 2014. |
Then, the soil samples have to be dried and sifted to remove large stones or clods. The dried soil is used to calibrate the soil moisture sensors to make certain that they are functioning properly before we put them into the ground.
Once the equipment has been tested, it's time for an installation! The tower must be erected and the sensors attached or inserted into the ground. After everything is grounded, attached, and plugged in comes the tense moment of checking the online database to make sure that everything is operating properly.
After the installation is complete, that doesn't mean that site visits are done. Equipment has to be checked periodically, and site visits can help build background information about any changes that are occurring at the site in terms of plant composition.
There's still work to be done back in the office as well! The months where it is too snowy and the ground too frozen for us to do site installs or updates are "data season" back in the office. This indoor time is used to look for interesting relationships in our data and to conduct background investigations on soil moisture research being conducted elsewhere.
If you want to take a look at some of our existing data yourself, visit the iRON's Downloadable Data page.
Wednesday, March 26, 2014
Thinking About Thaws
I can hardly believe that the end of March is upon us already. That being said, I feel ready for spring weather. March in Colorado often feels like a temperature toss-up, with some of us ready for spring to look like this:

 |
| Pansies. Image Credit: Amy Rice |
Although in the mountains, spring more often looks like this:
 |
| Snow near Glenwood, March 2011. Image Credit: ECO |
As ready as I am to thaw out my own chilly limbs, however, an early spring thaw isn't always a good thing in nature. Timing of thaws and snowmelt have impacts that last throughout the entire summer, long after the last of the snow has vanished. Some animals, like the wolverine, produce their young at the end of winter and need a lingering snowpack to insulate their dens and keep their young warm until air temperatures rise. Snow depth and date of snowmelt have broad impacts too, though, spanning the entire watershed.
Snow offers a form of water storage. It also keeps the ground underneath from drying out early in the spring. Once the snow melts completely in the spring, water begins evaporating from the ground as temperatures rise, and soil begins drying. A deep snowpack saturating the soil in early spring creates an important moisture base to provide plants with water until the next heavy summer rain event. If you look at the graph below, showing rain events and soil moisture at three depths for the 2013 growing season, you can see that rain events--even big ones--rarely soak into the ground enough to have a large impact on soil at the 20 inch depth. This means that for the deeper soil layer, the amount of snow that soaks into the ground in the spring may determine moisture availability for the entire season. How saturated the soil becomes in spring also determines the base moisture amount for the 2 and 8 inch depths, although a heavy rain mid-season can help replenish soil moisture moisture at the shallower depths.
Because snowmelt plays such an important role in soil saturation, the snow water equivalent (how much water you get if you melt the snow) on April 1st is sometimes used as an indicator for how much water will be available later in the year. If the snow melts rapidly or there is not much snow, then it may run off early or evaporate rather than soaking deep into the ground. This can have impacts for the entire water table, and thus for water availability in our streams and rivers.
Below is a graph showing the snow water equivalent on April 1st for an Independence Pass SNOTEL site in Colorado. The graph was created by AGCI for the City of Aspen using data from the National Resources Conservation Service. There has not been a strong trend in snow water equivalent since 1981.
 |
| Soil Moisture at 3 depths and temperature for the 2013 growing season. Image Credit: AGCI. |
Because snowmelt plays such an important role in soil saturation, the snow water equivalent (how much water you get if you melt the snow) on April 1st is sometimes used as an indicator for how much water will be available later in the year. If the snow melts rapidly or there is not much snow, then it may run off early or evaporate rather than soaking deep into the ground. This can have impacts for the entire water table, and thus for water availability in our streams and rivers.
Below is a graph showing the snow water equivalent on April 1st for an Independence Pass SNOTEL site in Colorado. The graph was created by AGCI for the City of Aspen using data from the National Resources Conservation Service. There has not been a strong trend in snow water equivalent since 1981.
 |
| Snow Water Equivalent on April 1st on Independence Pass in Colorado. Created using data available through NRCS. |
Snowmelt date and snow depth also influence the risk levels for the fire season. The earlier the soil dries out, the sooner the fire season begins. Drier soil means less water available to plants. It also means warmer ground temperatures because when soil is dry, is is less buffered against temperature change, so it heats more quickly if the air temperature is high. This past winter we were up above 100% snowpack. With the combination of cold temperatures and deeper snowpack, the soil has thawed later than it did last year when the winter was dry.
The two graphs below show data from our Sky Mountain soil moisture station for this year and last year. You can see that soil moisture at the 2 inch depth thawed over a week later in 2014 than it did in 2013 (March 9th vs. March 1st, respectively). The thaw is visible as a sudden spike in soil moisture. The 8 and 20 inch depths that later in the season. Last year, the 20 inch depth began thawing around April 1st. As of April 1st this year, the 20 inch thaw has yet to happen. These graphs also reveal that the soil is starting out the spring with a higher moisture content this year than last year.
 |
| Soil Moisture data from Sky Mountain, Colorado. Image Credit: AGCI |
In addition to the amount of snow we get each year, timing of runoff (the time of year when river flows are the highest) impacts human activities. Low snowpack, warmer temperatures, or a combination of both can lead to earlier than usual date of peak runoff. Farmers, hydro-electric plants, even municipal users also have ebbs and flows in the timing of when they use the most water, so timing of peak flow can be important to farmers, city planners, and others.
Changes in snowmelt timing also impact phenology: the timing of events in the natural world. Ecological impacts of earlier snowmelt are still being investigated by scientists. Warming average air temperatures across the globe (and here in the Roaring Fork Valley) may lead to snowpack melting sooner in the season. Once the insulating layer of snow is gone, and thaw begins, some plants to begin grow, even if the date is earlier than it has been in previous years. Of flowering plants that have been studied in the mountains, some begin growing and blooming earlier in the season as a response to early snowmelt. Others sprout from the ground earlier, but still bloom around the same time. Some flowers don't even begin growing early at all.
The timing of plant bloom, seeding, and growth is important to the survival of animals that eat them and, indirectly, the carnivores that eat those herbivores. As a result, a shift in timing the timing can have ecological impacts that move from plants all the way up the food chain.
Snow may be an inanimate object, but its role in providing insulation and soil moisture have widespread consequences for the plants and animals living in this valley.
Snow may be an inanimate object, but its role in providing insulation and soil moisture have widespread consequences for the plants and animals living in this valley.
Wednesday, December 18, 2013
If the world is warming, why am I so cold?
 |
| Icicles in Basalt, CO 2013. Credit: ECO |
The thermometer on our monitoring station at Sky Mountain recorded a low of -15 degrees Fahrenheit in the first week of the month. The thermometer at my own house, mid-valley, reads in the low teens each morning. So why, if global atmospheric warming is really happening, do these bitterly cold days still occur? To answer this question, you first have to take a look at the difference between weather and climate.
Humans tend to think in terms of weather. Might it be cold today? Is there enough snow for good skiing this week? Will there be water for my crops this summer? All of these weather conditions--measured as temperature, inches of rain, or wind speed--vary widely, sometimes even within the same day.
Climate is more stodgy than weather. It is slower to change and describes the average conditions found in a region over an extended period of time: decades or more. So climate describes what conditions generally existed in the past and allows us to project what conditions are generally likely occur in the future.
Weather, by contrast, describes what is happening at a single given moment. Ben Kirtman, a meteorologist who spoke on this topic at a public lecture in Aspen in 2011, described weather as being "the statistics of climate."
 |
| >20"-long icicles, Dec. 2013. Credit: ECO |
For example, let's take a look at an indicator of weather conditions in Aspen for 2011 vs. 2012. The indicator we will use is frost free days, or the number of days between the last frost in Spring and the first frost in Fall. The more frost free days in a year, the longer the warm season. For more about the significance of frost free days in the valley, visit iRON's "Temperature and Frost" page.
In 2011, Aspen had 128 frost free days. In 2012, that number dropped to 106. If you looked only at these two years, it would seem as though frost free days in Aspen are decreasing, in other words, it is getting colder, and the growing season is not lasting as long. Looking only at these two years, however, would be like watching your baseball player for just two innings. When you place these two years in perspective with 70 years worth of data, frost free days tell a very different story. Below is a graph showing the average number of frost free days for each decade since 1940 in Aspen, Colorado.
Looking at average frost free days over this longer period of time, you see an upward trend. Compared to the 1940's and 1950's, this decade has an average of 30 more frost free days--an entire additional month that did not have frost.
 |
| Frost Free Days from the Aspen Weather Station. Note that the station moved to a higher elevation in 1980. Data available through NCDC. For further information on ecology and frost free days, visit the FHI website |
 |
| Days below 0 Deg F. Data is from the Aspen weather station, which moved to a higher elevation in 1980. Data is available through NCDC. For further information on ecological importance of very cold days, visit the FHI website |
Frosty days and icy nights have been a part of Colorado's climate for 100's of years before today, and the ecosystems and native species that make the Roaring Fork Valley unique are present because of their ability to succeed in those previous conditions. Changes in weather can determine the survival of an individual, but changes in climate can determine the survival of an entire species.

Thursday, November 14, 2013
You don't know where you're going until you know where you've been...

Hiking through a powdery layer of snow on a crisp day in early November, moisture for the valley was looking promising for this fall. It was not even Thanksgiving, and the snow was already deep enough to over-top our boots when we went off trail. There were other clues as well, hinting this was a wet late summer/early fall. Many service berry bushes were still loaded with fruit. The fruits were dry and wizened by then, but the fact they still clung to the brown branches suggests that berries were so plentiful this summer that the bears and birds found more than they could eat. But is this really a wet year or a normal year? What is normal? These are questions that observations of just a day or even just a season can't answer. These are the types of questions that require gathering information long before you know you'll need it.
 |
| This monitoring station measures air temperature, soil moisture, relative humidity, and precipitation. Credit: Marci Krivonen |
Human activities--where we live, what crops we grow, where we vacation--are based on assumptions about the conditions of certain areas, and if conditions in those areas change, they may no longer be able to support the our activities. Natural systems likewise require specific conditions to function and survive. By looking at conditions in the past and comparing them to the success of human or natural systems, we are able to gain understanding about what conditions are conducive to a system thriving and what conditions may threaten it.
With the widespread use of human fossil fuels that skyrocketed in the 20th century, changes have begun occurring on our planet at a rapid rate and on a large scale. Monitoring provides a lens through which we can study those changes. Looking at a past dataset, the last 100 years of temperature for example, gives us an idea of what we may need to prepare for in the future. If we saw that the average temperatures for each year went up and down a little bit over the past century but that the cold periods and warm periods alternated pretty regularly, then we could speculate that the climate in the valley is likely to continue to be similar to conditions in the past and can plan our growing season accordingly. If the average yearly temperatures vary from year to year, but in general show that each decade is on average warmer than the last, then we can speculate that our future climate is likely to be warmer than our past one has been. Warmer temperatures on a regular basis translate into local concerns such as higher risk of fire and the possibility of drier soil during the growing season.
 |
| The famous Keeling curve shows a clear trend in atmospheric CO2. Credit: NOAA |
Mundane though gathering data (by instruments or by hand) on a regular, extended basis may be, monitoring data have been the trigger for important discoveries and even political and social debate. Perhaps the most well-known example of a revolutionary monitoring application is the CO2 monitoring station on Mona Loa. Founded by Charles David Keeling in the late 1950's, the instruments on this Hawaiian volcano provided scientists with evidence that atmospheric CO2 levels were rising at an unprecedented rate. Because of CO2's role as a greenhouse gas, this data provided warning of a potential global warming trend.
 |
| Service berries in November. Credit: AGCI |
Subscribe to:
Posts (Atom)